Can a line chart set different background colors for each section along the y-axis?
Problem Description
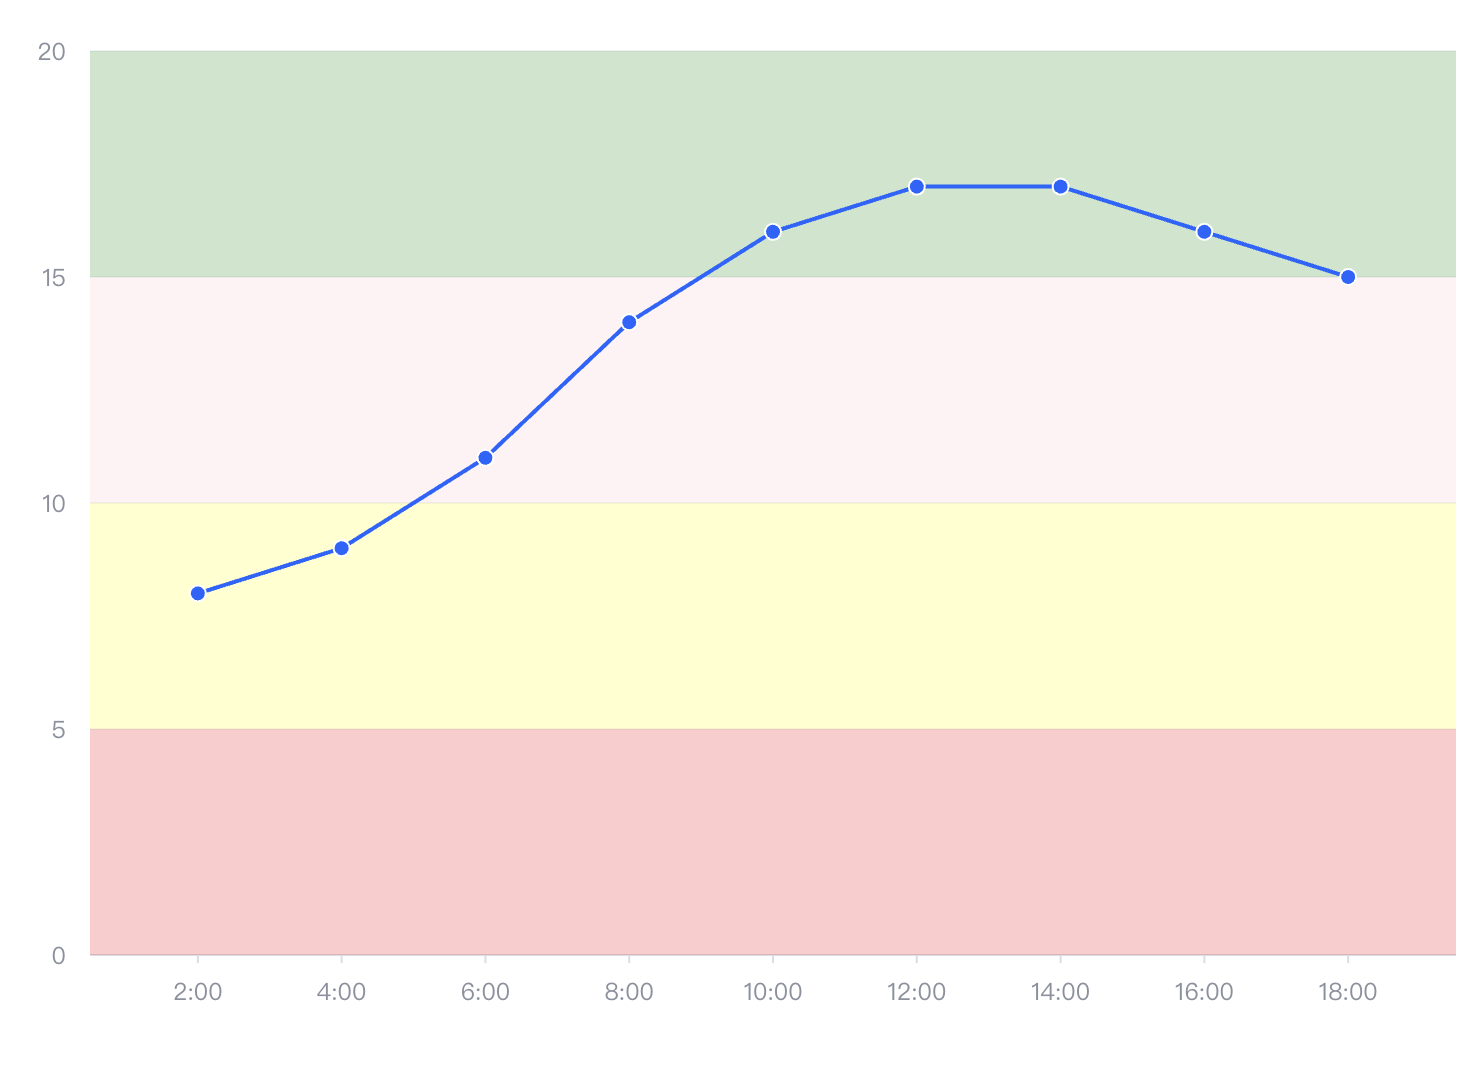
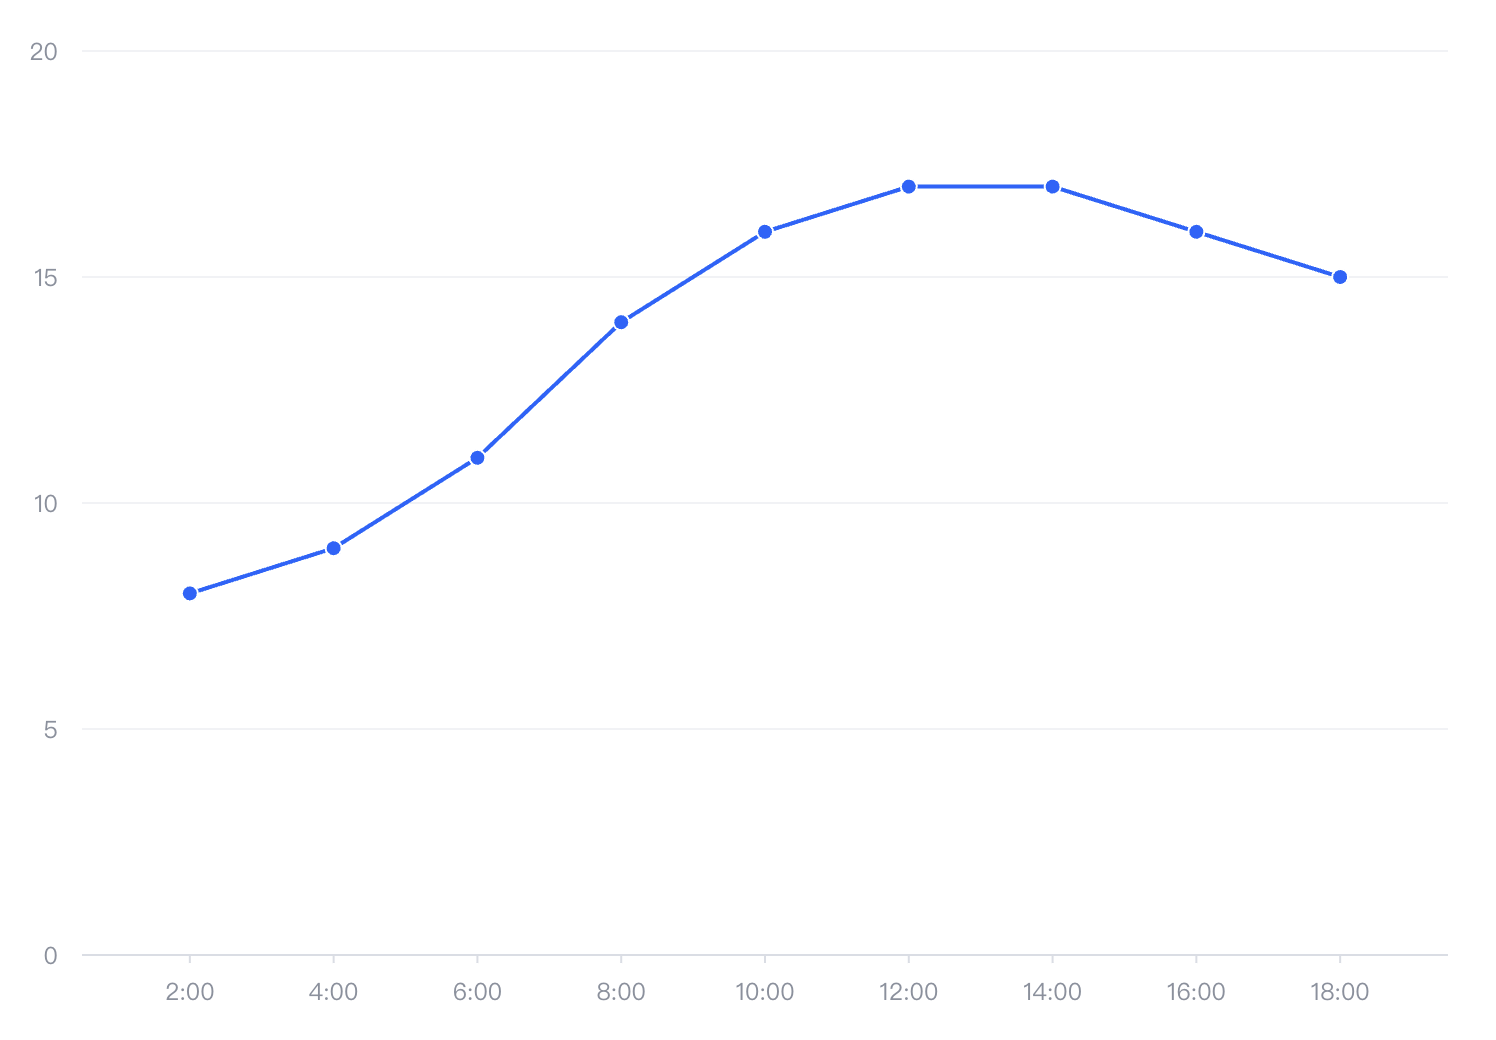
In the following line chart, is it possible to set background colors for each section along the y-axis?
Solution
There are two ways you can achieve this background color request.
- Solution 1: You can set the grid fill color by configuring
axes.grid.alternateColor:
axes: [
    {
      orient: 'left',
      grid: {
        alternateColor: [
          'rgba(0, 255, 0, 0.3)',
          'rgba(255, 0, 0, 0.2)',
          'rgba(0, 0, 255, 0.2)'
          ]
      }
    }
  ]</br>
- Solution 2: VChart supports a variety of annotation components, among which
markAreacan be used to configure annotation blocks. Therefore, we can configure the background color blocks in the following way
markArea: [
    {
      y: 0,
      y1: 5,
      area: {
        style: {
          fill: 'red',
          fillOpacity: 0.2
        }
      }
    },

    {
      y: 5,
      y1: 10,
      area: {
        style: {
          fill: 'yellow',
          fillOpacity: 0.2
        }
      }
    },

    {
      y: 10,
      y1: 15,
      area: {
        style: {
          fill: 'pink',
          fillOpacity: 0.2
        }
      }
    },

    {
      y: 15,
      y1: 20,
      area: {
        style: {
          fill: 'green',
          fillOpacity: 0.2
        }
      }
    },
   ]</br>
Code Examples
const spec = {
  type: 'line',
  data: {
    values: [
      {
        time: '2:00',
        value: 8
      },
      {
        time: '4:00',
        value: 9
      },
      {
        time: '6:00',
        value: 11
      },
      {
        time: '8:00',
        value: 14
      },
      {
        time: '10:00',
        value: 16
      },
      {
        time: '12:00',
        value: 17
      },
      {
        time: '14:00',
        value: 17
      },
      {
        time: '16:00',
        value: 16
      },
      {
        time: '18:00',
        value: 15
      }
    ]
  },
  xField: 'time',
  yField: 'value',
  markArea: [
    {
      y: 0,
      y1: 5,
      area: {
        style: {
          fill: 'red',
          fillOpacity: 0.2
        }
      }
    },

    {
      y: 5,
      y1: 10,
      area: {
        style: {
          fill: 'yellow',
          fillOpacity: 0.2
        }
      }
    },

    {
      y: 10,
      y1: 15,
      area: {
        style: {
          fill: 'pink',
          fillOpacity: 0.2
        }
      }
    },

    {
      y: 15,
      y1: 20,
      area: {
        style: {
          fill: 'green',
          fillOpacity: 0.2
        }
      }
    },
   ]
};</br>
Results Show